
You have the data. The problem is, it’s stuck in spreadsheets and static reports, slowing decisions instead of speeding them up.
The problem: Sales teams waste time hunting for numbers, then argue about whose numbers are correct.
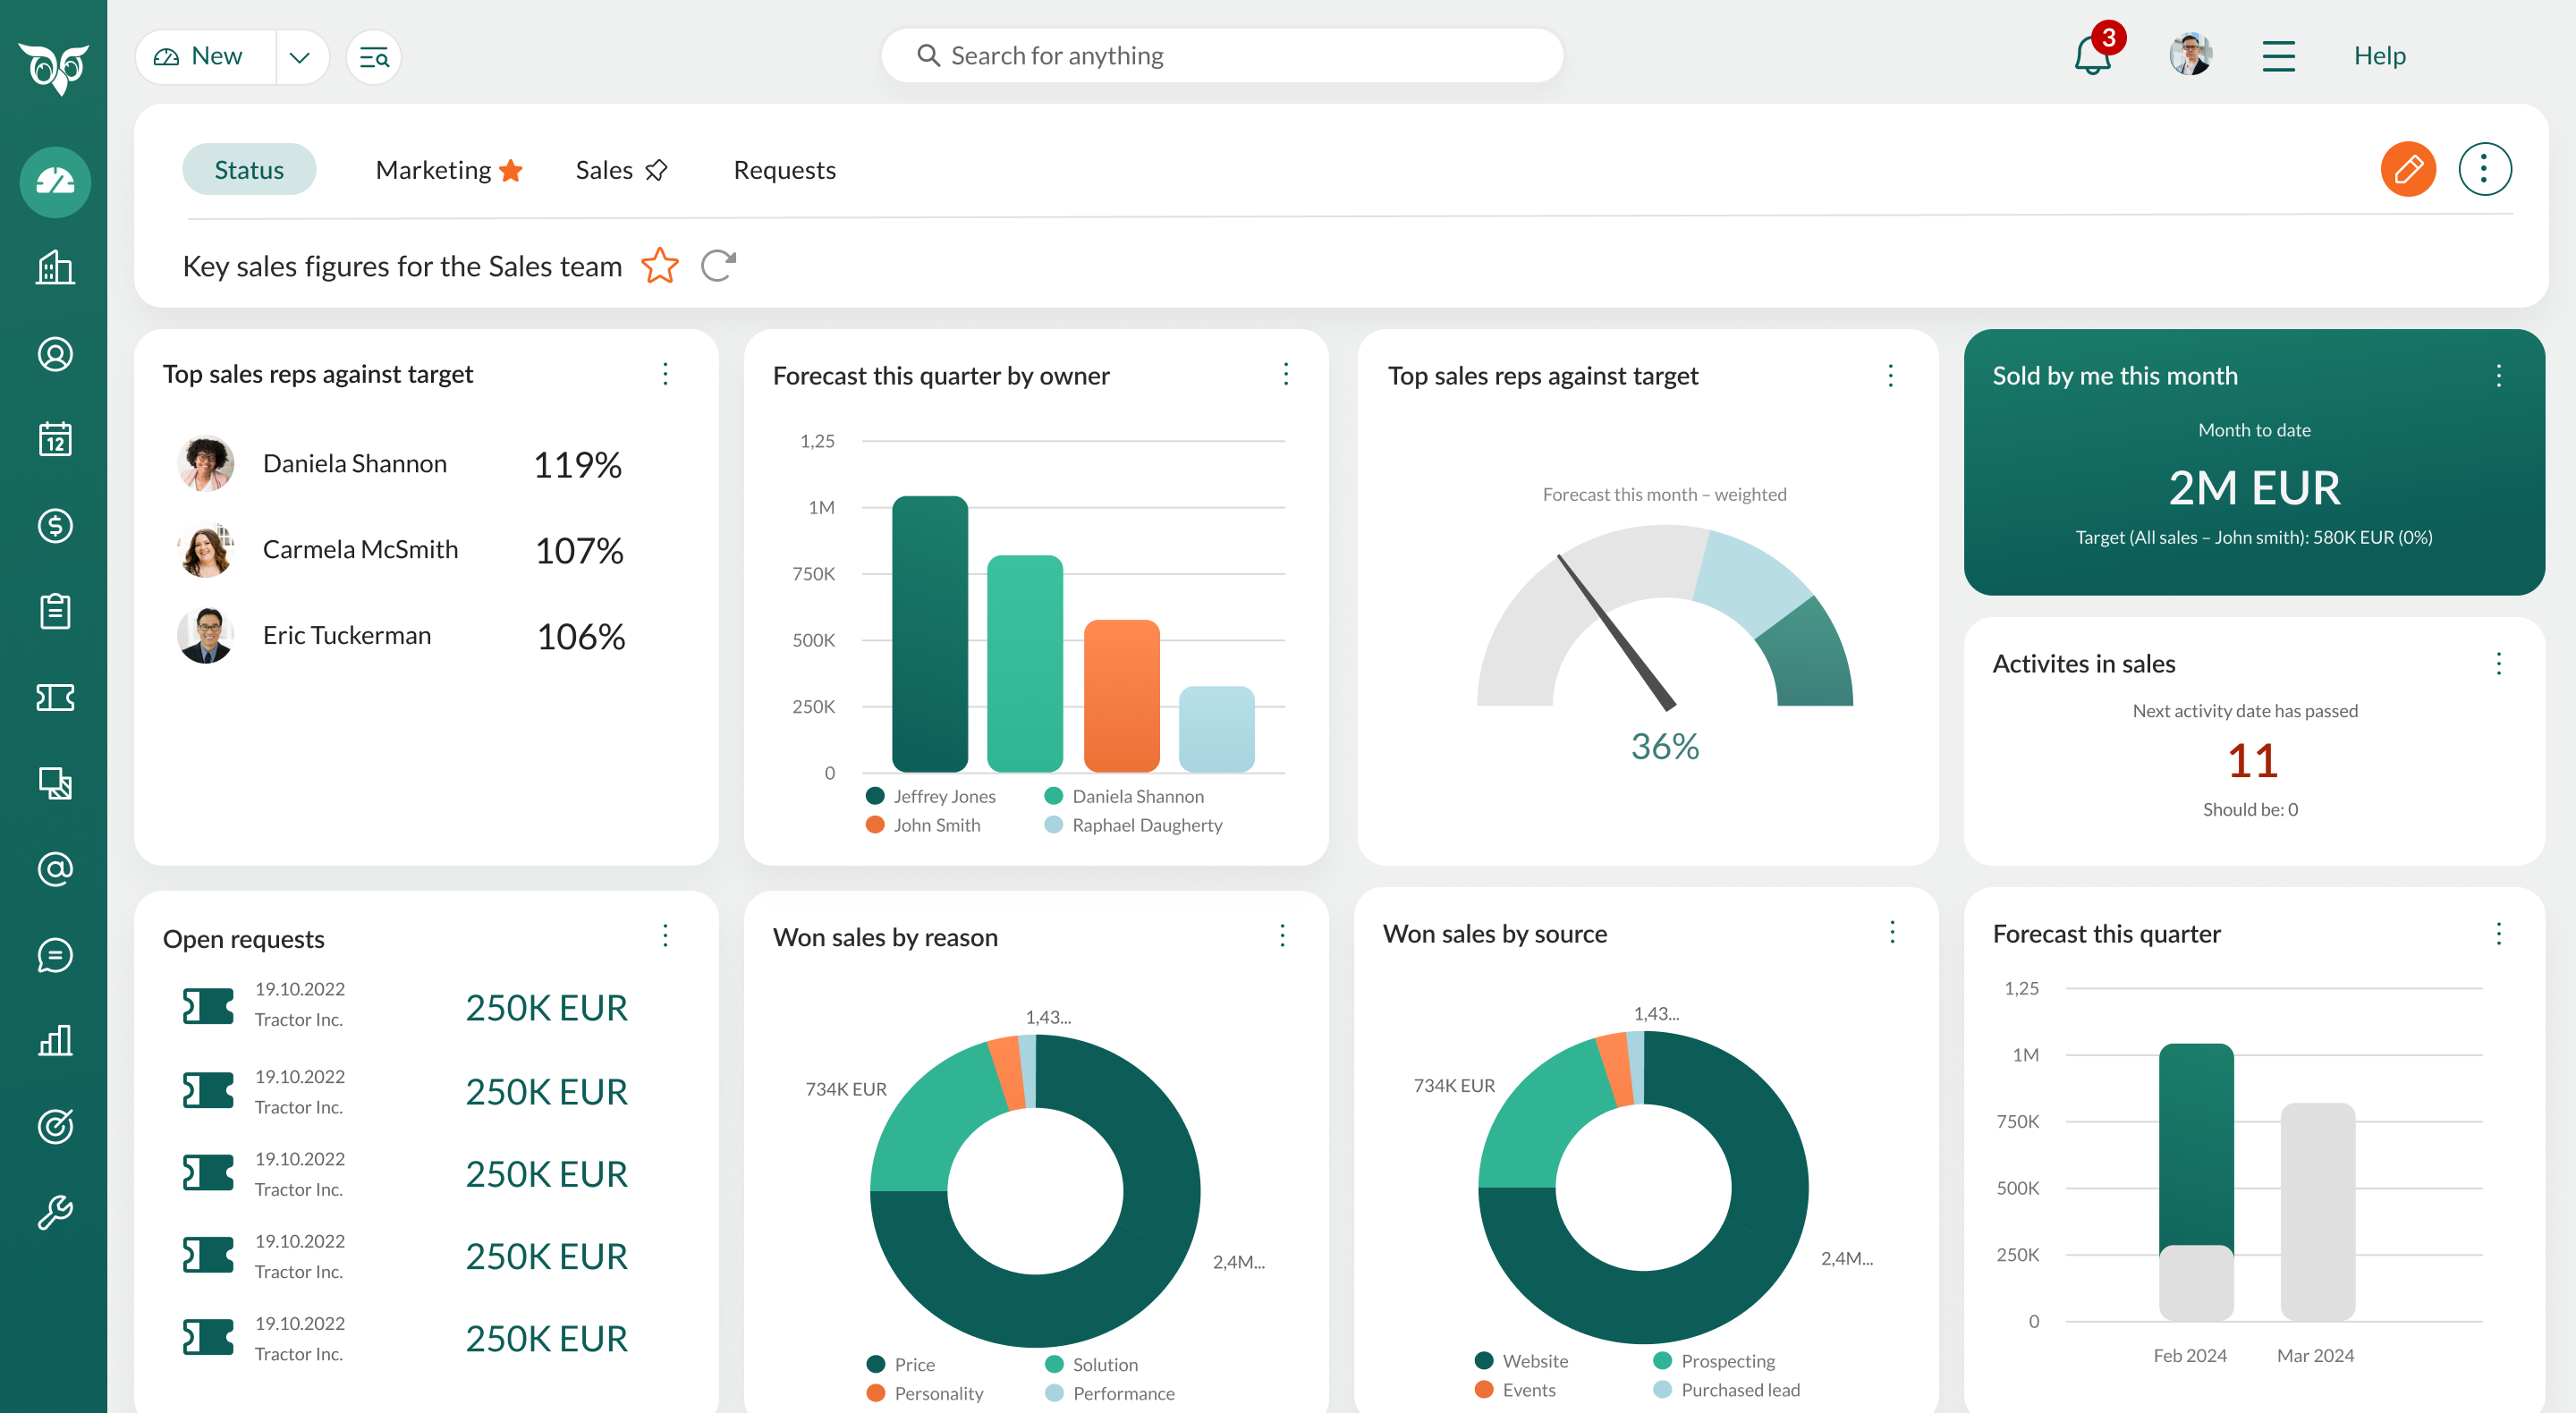
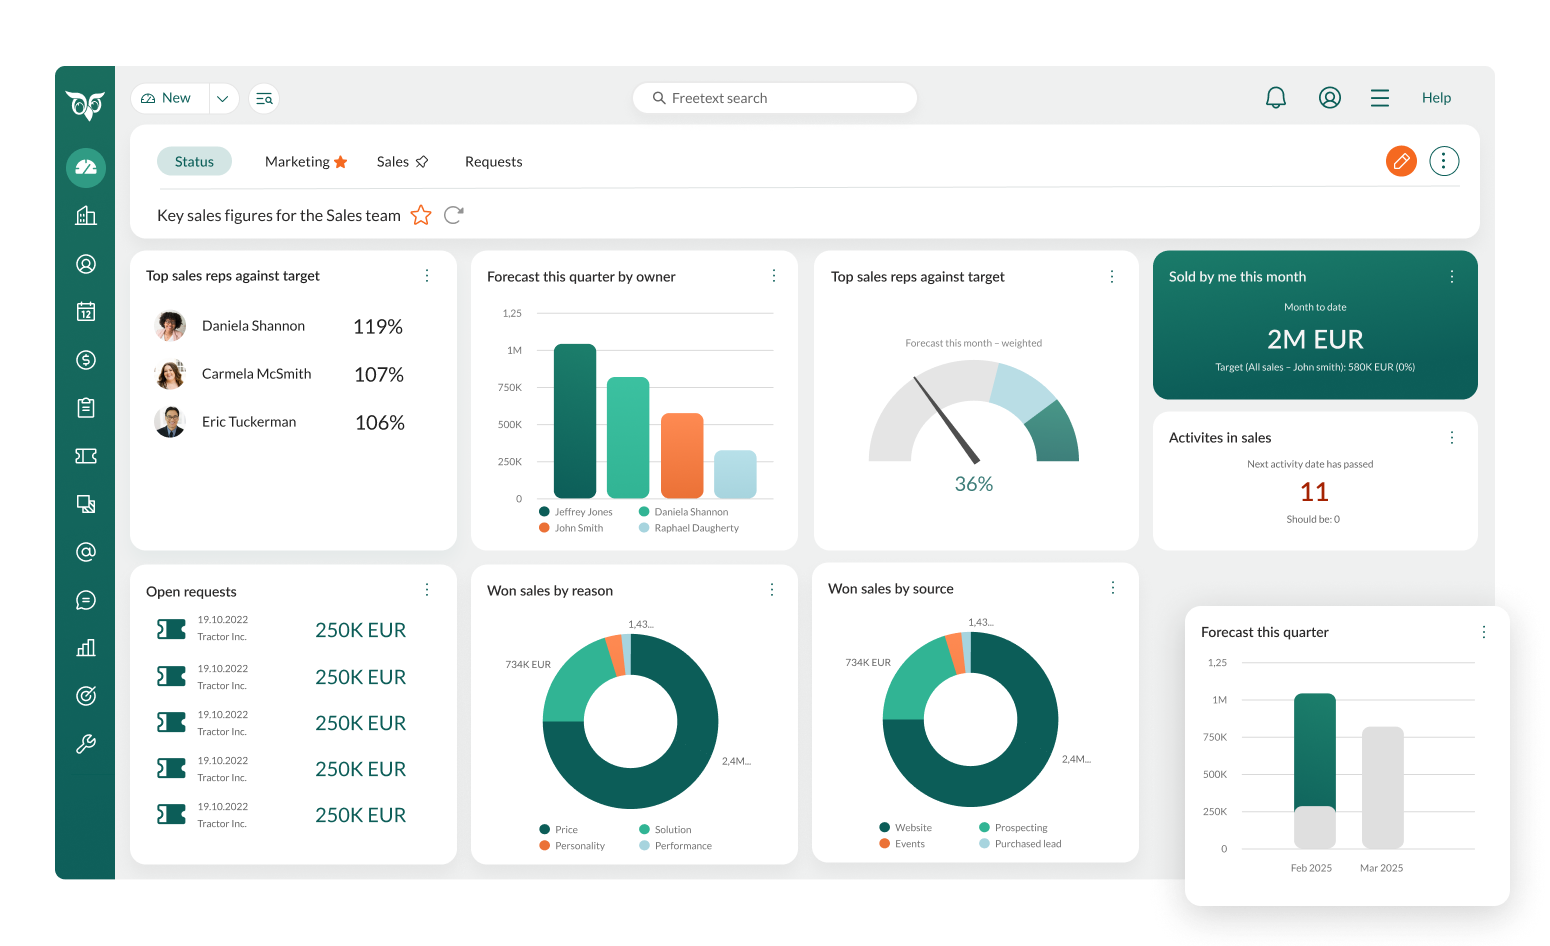
The solution: A customisable sales dashboard that shows the right KPIs for the right role at the right time.
The proof: When pipeline, activity, and forecasting signals are visible in one place, you spot risk earlier and act faster.
Are you getting the most out of your sales data?
Sales teams thrive on data. Without the right tools, you end up with information overload rather than clarity. Spreadsheets, manual reports, and scattered data make it hard to track key metrics, prioritise deals, and forecast revenue accurately.
The answer is a customisable sales dashboard.
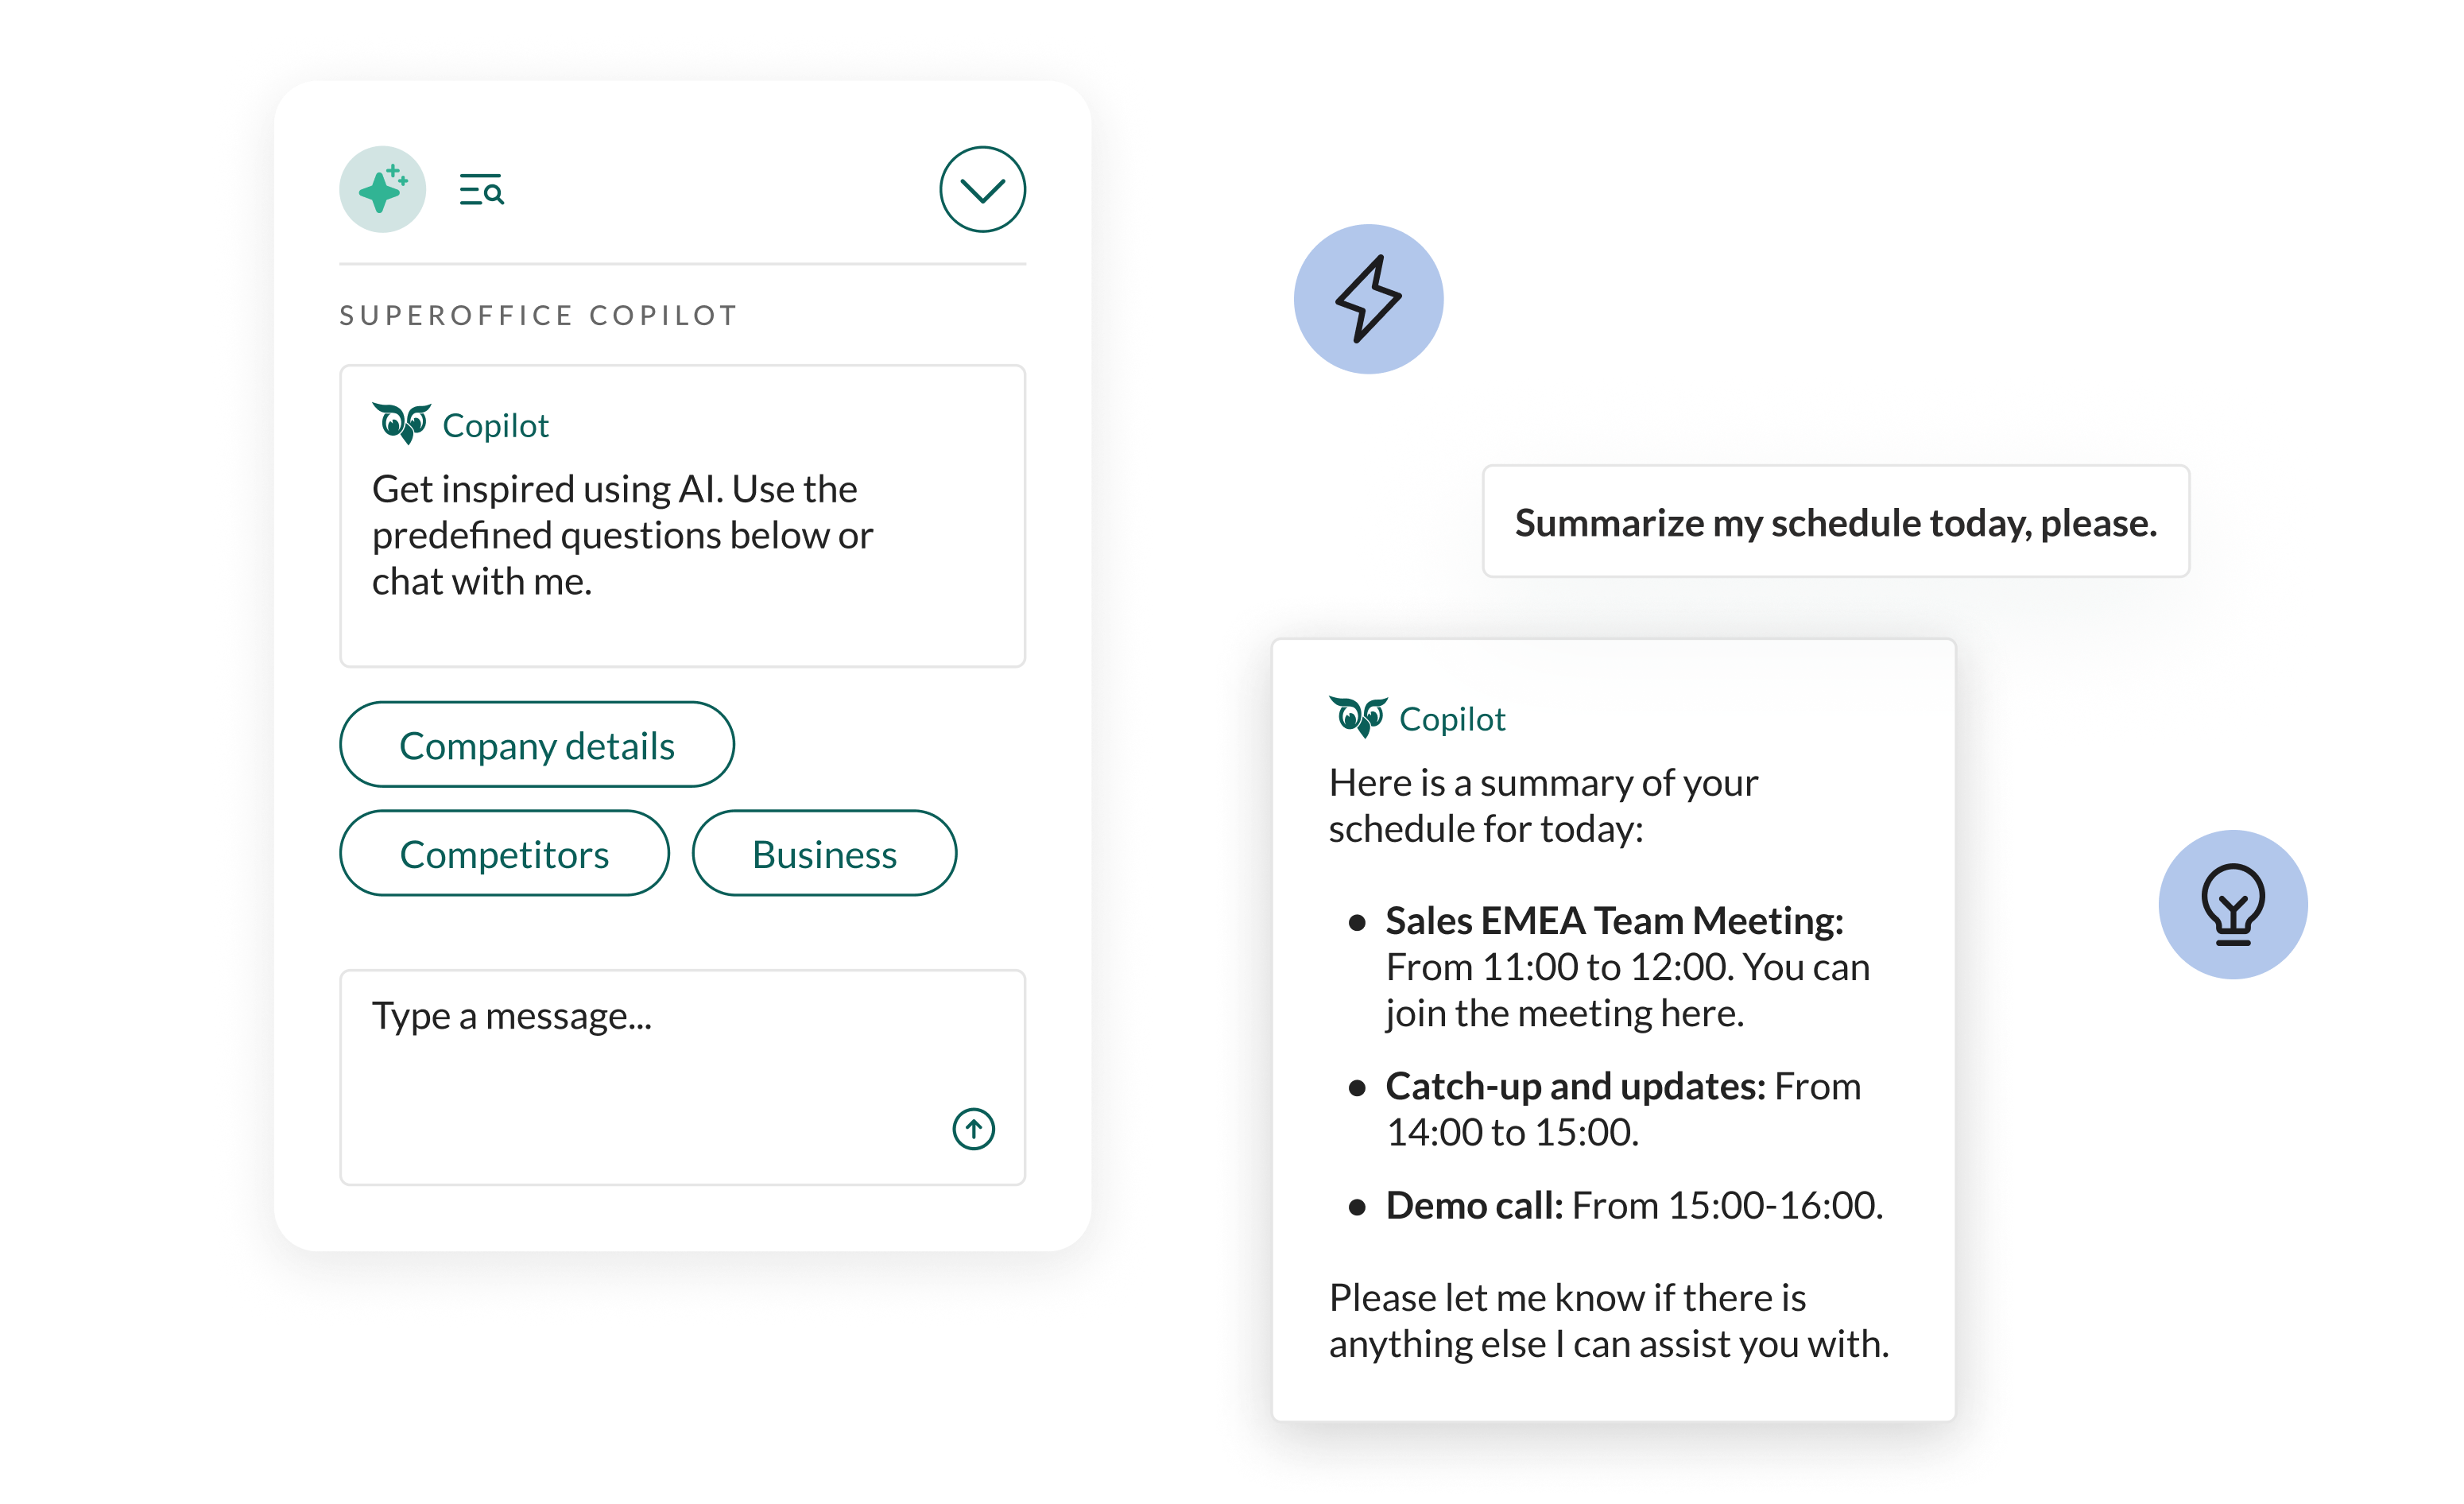
A well-designed dashboard turns raw data into real-time insights, helping you make smarter, faster decisions across the whole pipeline.
In this article, you will learn why customisable dashboards matter, which metrics to include, and how to set up dashboards that your team will actually use.
Why customisable dashboards matter in sales
Every sales team operates differently.
Your sales strategy, key performance indicators (KPIs), and reporting needs depend on your industry, customer base, and internal goals. A one-size-fits all dashboard rarely fits anyone well.
Customisable sales dashboards matter because they give you:
- Instant visibility so you can see pipeline health, deals, and targets in one place.
- Actionable insights so you can spot trends, bottlenecks, and opportunities quickly.
- Higher efficiency because you stop pulling manual reports and spend more time selling.
- Better collaboration because reps, managers, and leadership work from the same shared view.
With a dashboard tailored to your workflow, you spend less time searching for data and more time moving deals forward.
The 5 key metrics to track in your sales dashboard
A powerful sales dashboard focuses on the KPIs that drive behaviour and results. Start with these essentials, then adapt them to your sales process.
1) Sales pipeline overview
To get a clear sales pipeline overview, track the number of open opportunities, deal stages, and potential revenue.
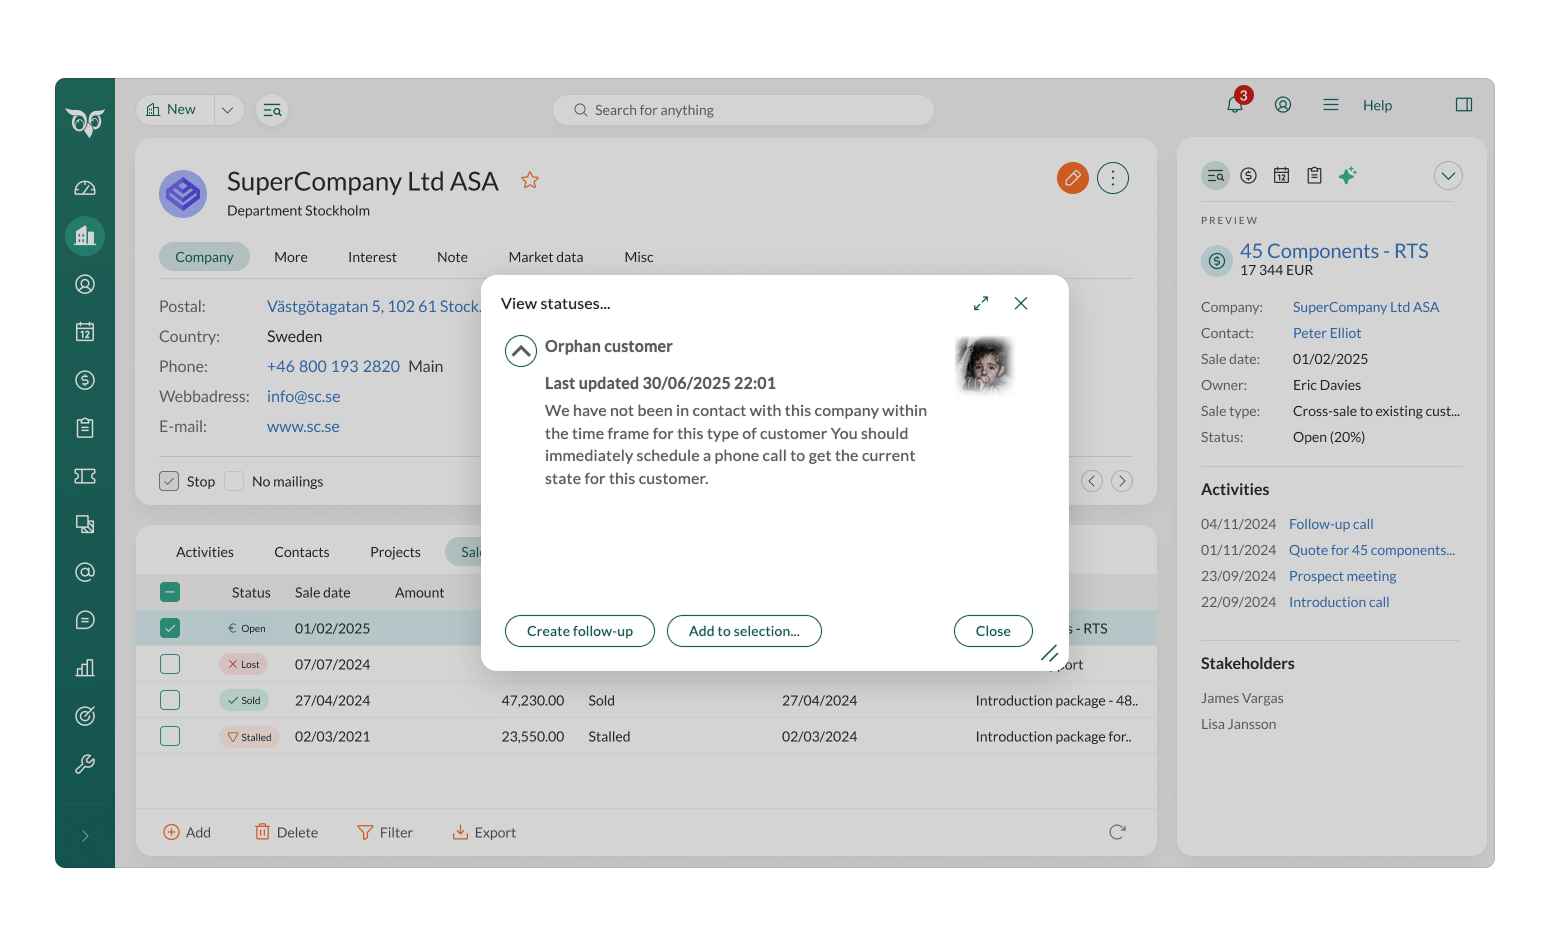
You should be able to see which deals are progressing and where they are stalling. This helps you remove friction before it affects the forecast.
2) Revenue and sales targets
Monitor monthly, quarterly, and annual goals.
Compare actual performance with targets so you can course correct early, not at the end of the quarter.
3) Lead conversion rates
Measure how effectively leads convert into opportunities and closed deals.
Conversion trends reveal whether your issue is lead quality, follow up discipline, or qualification standards.
4) Sales activity tracking
Effective sales activity tracking means monitoring calls, meetings, follow-ups, and next steps.
Activity metrics give you early warning signals. They show whether the team is building momentum or drifting towards a quiet pipeline.
5) Win and loss analysis
Identify patterns in successful deals versus lost opportunities.
This helps you improve qualification, sharpen messaging, and learn where deals typically break down.
Want a wider view of what to track and why? Explore this guide to the best sales CRM tools for pipeline tracking to see how different approaches compare.
How customisable dashboards improve sales performance
A generic CRM dashboard can be useful. A customisable dashboard aligns with your sales process and shows what matters most to each role.
1) Personalised views for every role
Sales reps, managers, and executives have different priorities. Role specific dashboards help each person focus on what they can control.
- Reps track their deals, activities, and follow-ups.
- Managers monitor team performance, pipeline health, and coaching opportunities.
- Leaders review revenue trends, forecast confidence, and business growth signals.
Practical tip: Create role-based dashboards so each team member sees the numbers that support their day to day decisions.
2) Real-time data for better decision making
Waiting for monthly reports creates blind spots. Real-time dashboards help you act while there is still time to change the outcome.
- Spot stalled deals and intervene early.
- Track quota progress and adjust priorities. •
- Identify dips in activity before the pipeline dries up.
Practical tip: Set alerts for stalled deals, low activity, or a sudden drop in pipeline value so you can respond immediately.
3) Improved sales forecasting
Forecasting improves when you track leading indicators, not only total pipeline value.
By monitoring historical trends, sales cycle length, and stage conversion, you get clearer signals about which deals are likely to close and when.
Practical tip: Separate views for committed, best case, and pipeline so you can manage risk without inflating expectations.
4) Faster response to sales trends
When you can spot change quickly, you can adapt faster than competitors.
A custom dashboard helps you recognise:
- underperforming regions or product lines
- high value opportunities that need attention now
- shifts in customer behaviour that signal a new approach
Practical tip: Add simple trend tiles that compare this month with last month, and this quarter with last quarter.
5) Increased sales rep accountability
When reps can see their progress clearly, accountability feels fair and motivating.
- Show progress towards individual and team targets to keep performance visible.
- Track daily and weekly activity to maintain momentum.
- Encourage friendly competition with leaderboard-style widgets, without adding pressure.
Practical tip: Set up automated weekly summaries with each rep so performance stays visible without extra admin, keeping them informed and engaged.
6) Better lead and opportunity management
Better lead and opportunity management becomes critical when deal volume is high, and dashboards help you stay focused on the right prospects.
- Highlight your hottest prospects using lead prioritisation so your team focuses on the opportunities most likely to convert.
- Track touchpoints per lead so follow-ups do not slip and engagement stays consistent.
- Monitor deal progression to prevent opportunities going stale and keep your pipeline moving.
Practical tip: Set up a “hot lead” view that filters prospects based on engagement and readiness to buy.
7) Connected data across sales, marketing, and service
The best dashboards do not exist in isolation. When your sales view includes marketing and service signals, you get stronger context.
- See which campaigns create the highest quality leads. •
- Spot service issues that could block a renewal or expansion.
- Align outreach with real customer behaviour.
Practical tip: Track lead source and campaign performance alongside pipeline movement, then use that insight to qualify leads faster and focus on the opportunities most likely to close.
Conclusion
Sales dashboards are not just about data. They are about focus, and making your sales process more efficient and effective.
A well-structured, customisable dashboard helps every rep know where to spend their time. It also gives managers real-time visibility into pipeline health, performance patterns, and forecast risk.
With instant access to the right metrics, your team can adapt to change, spot problems earlier, and act on opportunities faster.
SuperOffice CRM: Customisable dashboards built for sales teams
Not all CRM dashboards are created equal.
SuperOffice Sales gives you customisable dashboards designed to match how your team sells:
- Drag and drop customisation so you can build dashboards that fit your workflow.
- Role-based access so reps, managers, and leadership see what matters to them.
- Seamless integration with email, calendar, and key tools for a fuller pipeline picture.
- Mobile access so you can stay on top of performance wherever you work.
If you are still comparing options, explore this overview of the best sales CRM tools to shortlist the right approach.


